![[C# Helper]](../banner260x75.png)
|
|
 |
![[Beginning Database Design Solutions, Second Edition]](db2_79x100.png)
![[Beginning Software Engineering, Second Edition]](book_sw_eng2_79x100.png)
![[Essential Algorithms, Second Edition]](book_algs2e_79x100.png)
![[The Modern C# Challenge]](book_csharp_challenge_80x100.jpg)
![[WPF 3d, Three-Dimensional Graphics with WPF and C#]](book_wpf3d_80x100.png)
![[The C# Helper Top 100]](book_top100_80x100.png)
![[Interview Puzzles Dissected]](book_interview_puzzles_80x100.png)
![[C# 24-Hour Trainer]](book_csharp24hr_2e_79x100.jpg)
![[C# 5.0 Programmer's Reference]](book_csharp_prog_ref_80x100.png)
![[MCSD Certification Toolkit (Exam 70-483): Programming in C#]](book_c_cert_80x100.jpg)

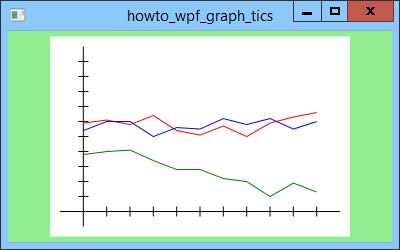
Title: Draw a graph with even tic marks in WPF and C#
This example shows how you can draw a graph with even tic marks in WPF and C#. It's easy but confusing so I'm going to over-explain it. Once you get the idea, just skip down to the code. If you look closely at the picture in the post Use transformations to draw a graph in WPF and C#, you'll see that the tic marks on the X and Y axes have slightly different lengths. That's because I just guessed at world coordinate lengths for them. The world-to-device coordinate transformations didn't give exactly the same lengths, so the tic marks are uneven. The real problem is that the program draws the tic marks in world coordinates but you measure them (by looking at them) in device coordinates. One way to fix this is to start with the desired device coordinate lengths and transform them back into world coordinate lengths. Then when you draw in world coordinates, the tic marks have the desired lengths. When it's drawing its graph, the program first uses the following code to calculate the tic marks' lengths in world coordinates.
// Get the tic mark lengths. Point p0 = DtoW(new Point(0, 0)); Point p1 = DtoW(new Point(5, 5)); double xtic = p1.X - p0.X; double ytic = p1.Y - p0.Y; This code creates two Point objects, one representing (0, 0) and one representing (5, 5) in device coordinates. Those points are 5 pixels apart vertically and horizontally. The code uses the DtoW method to convert the points from device coordinates to world coordinates. It then subtracts the points' X and Y coordinates to get the horizontal and vertical distances between them in world coordinates, whatever they happen to be. (They happen to be 2.14 horizontally and and -0.33 vertically. The Y distance is negative because the scaling transformation flips Y values, as you may recall from the previous example.) Now if you draw a horizontal segment 2.14 units long in world coordinates, it is transformed into a segment 5 pixels long in device coordinates. Similarly if you draw a vertical segment -0.33 units long in world coordinates, it is transformed into a segment 5 pixels long in device coordinates. (Note that this doesn't say much about segments that are neither vertical nor horizontal.) Having calculated the necessary tic mark lengths on world coordinates, the program uses them to draw the tic marks. For example, the following code shows how the program creates the tic marks on the X axis.
for (double x = xstep; x <= wxmax - xstep; x += xstep) { Point tic0 = new Point(x, -ytic); Point tic1 = new Point(x, ytic); xaxis_geom.Children.Add( new LineGeometry(WtoD(tic0), WtoD(tic1))); } This code loops over X values. For each value, it draws the distance ytic above and below the X axis, giving a tic mark with length 2 × ytic, which tansforms into 10 pixels in device coordinates. The code that draws the Y axis's tic marks is similar. Download the example to experiment with it and to see additional details. |