![[C# Helper]](../banner260x75.png)
|
|
 |
![[Beginning Database Design Solutions, Second Edition]](db2_79x100.png)
![[Beginning Software Engineering, Second Edition]](book_sw_eng2_79x100.png)
![[Essential Algorithms, Second Edition]](book_algs2e_79x100.png)
![[The Modern C# Challenge]](book_csharp_challenge_80x100.jpg)
![[WPF 3d, Three-Dimensional Graphics with WPF and C#]](book_wpf3d_80x100.png)
![[The C# Helper Top 100]](book_top100_80x100.png)
![[Interview Puzzles Dissected]](book_interview_puzzles_80x100.png)
![[C# 24-Hour Trainer]](book_csharp24hr_2e_79x100.jpg)
![[C# 5.0 Programmer's Reference]](book_csharp_prog_ref_80x100.png)
![[MCSD Certification Toolkit (Exam 70-483): Programming in C#]](book_c_cert_80x100.jpg)

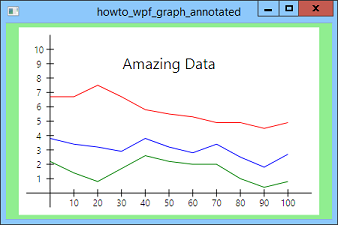
Title: Draw a graph with labels in WPF and C#
This example shows how you can draw a graph with labels. The previous example Draw a graph with even tic marks in WPF and C# draws a simple graph. This example adds a title and labels to the X and Y axes. To make creating labels easier, the program uses the following DrawText method.
// Position a label at the indicated point. private void DrawText(Canvas can, string text, Point location, double font_size, HorizontalAlignment halign, VerticalAlignment valign) { // Make the label. Label label = new Label(); label.Content = text; label.FontSize = font_size; can.Children.Add(label); // Position the label. label.Measure(new Size(double.MaxValue, double.MaxValue)); double x = location.X; if (halign == HorizontalAlignment.Center) x -= label.DesiredSize.Width / 2; else if (halign == HorizontalAlignment.Right) x -= label.DesiredSize.Width; Canvas.SetLeft(label, x); double y = location.Y; if (valign == VerticalAlignment.Center) y -= label.DesiredSize.Height / 2; else if (valign == VerticalAlignment.Bottom) y -= label.DesiredSize.Height; Canvas.SetTop(label, y); } Most of the method's parameters are self-explanatory, but the last two deserve a little explanation. Those are alignment values that dertermine how the text should be positioned. For example, if halign is Left, then the text should be aligned so it's left edge is at the indicated point. When it starts, the method first creates a Label control, sets its text and font size, and adds it to the Canvas control's children. Next the code calls the Label object's Measure method. That method takes as parameters the amount of space available and returns the size the control wants to have. To let the Label be as large as it wants (so it doesn't wrap the text), the code passes the value double.MaxValue into the method. Next the code calculates the position where it should place the Label in device coordinates. The location parameter is in device coordinates. The code sets the x variable to the desired X coordinate and then adjusts it if you want the text centered or right-aligned. It then calls the Canvas class's SetLeft method to set the Label control's Left property. This is a bit weird so I'll say a bit more about it. The Label class doesn't have a Left property. This is an attached property provided by a Canvas control for the control's it contains. Because Left isn't a property of the Label control, you can't just set label.Left equal to a value. Instead you use the Canvas class's static SetLeft method to set the value for another control, in this case the Label. After setting the Label control's X coordinate, the code uses similar steps to set its Y coordinate. That's all there is to it. After this point, the Label displays its text automatically. (In my next post, I'll show how you can display rotated text on the graph. It's actually surprisingly easy.) Download the example to experiment with it and to see additional details. |