![[C# Helper]](../banner260x75.png)
|
|
 |
![[Beginning Database Design Solutions, Second Edition]](db2_79x100.png)
![[Beginning Software Engineering, Second Edition]](book_sw_eng2_79x100.png)
![[Essential Algorithms, Second Edition]](book_algs2e_79x100.png)
![[The Modern C# Challenge]](book_csharp_challenge_80x100.jpg)
![[WPF 3d, Three-Dimensional Graphics with WPF and C#]](book_wpf3d_80x100.png)
![[The C# Helper Top 100]](book_top100_80x100.png)
![[Interview Puzzles Dissected]](book_interview_puzzles_80x100.png)
![[C# 24-Hour Trainer]](book_csharp24hr_2e_79x100.jpg)
![[C# 5.0 Programmer's Reference]](book_csharp_prog_ref_80x100.png)
![[MCSD Certification Toolkit (Exam 70-483): Programming in C#]](book_c_cert_80x100.jpg)

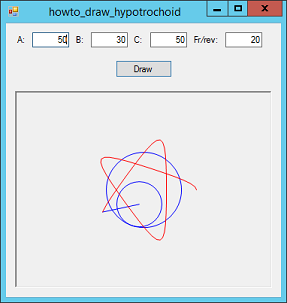
Title: Draw an animated hypotrochoid (Spirograph curve) in C#
The example Draw a hypotrochoid (Spirograph curve) in C# shows how to draw a hypotrochoid. This example animates drawing the curve so you can see how the circles trace out the curve's path. The program uses a Timer with Interval = 100 so it draws a new frame every 100 milliseconds (or 10 times per second). The following code shows how the program prepares to draw the curve.
// The angle from one circle's center to the other.
private float theta = 0;
private float dtheta;
// Drawing parameters.
private int A, B, C, wid, hgt, cx, cy;
private double max_t;
private List The program stores various drawing parameters such as the radii of the circles in class-level variables. It stores the list of points generated as it goes along the List<PointF> named points. It stores the angle it is using for parametric calculations in a variable named theta. The following code shows the Timer's Tick event handler.
// Redraw the curve. private void tmrDraw_Tick(object sender, EventArgs e) { theta += dtheta; DrawCurve(); } The event handler increments theta and calls the DrawCurve method shown in the following code.
// Draw the curve. private void DrawCurve() { Bitmap bm = new Bitmap(wid, hgt); using (Graphics gr = Graphics.FromImage(bm)) { gr.SmoothingMode = SmoothingMode.AntiAlias; // Draw the outer circle. gr.DrawEllipse(Pens.Blue, cx - A, cy - A, 2 * A, 2 * A); // Draw the inner circle. int r = A - B; float cx1 = (float)(cx + r * Math.Cos(theta)); float cy1 = (float)(cy + r * Math.Sin(theta)); gr.DrawEllipse(Pens.Blue, cx1 - B, cy1 - B, 2 * B, 2 * B); // Add the next point. PointF new_point = new PointF( (float)(cx + X(theta, A, B, C)), (float)(cy + Y(theta, A, B, C))); points.Add(new_point); // Draw the line. gr.DrawLine(Pens.Blue, new PointF(cx1, cy1), new_point); // Draw the points. if (points.Count > 1) gr.DrawLines(Pens.Red, points.ToArray()); } picCanvas.Image = bm; if (theta > max_t) tmrDraw.Enabled = false; } The DrawCurve method creates a new Bitmap. It draws the circles that determine how the curve is generated and calculates the next point on the curve. It adds a new point to the hypotrochoid. It then draws the line that traces out the path and finally draws the points. The method finishes by displaying the new Bitmap. Download the example to experiment with it and to see additional details. |