![[C# Helper]](../banner260x75.png)
|
|
 |
![[Beginning Database Design Solutions, Second Edition]](db2_79x100.png)
![[Beginning Software Engineering, Second Edition]](book_sw_eng2_79x100.png)
![[Essential Algorithms, Second Edition]](book_algs2e_79x100.png)
![[The Modern C# Challenge]](book_csharp_challenge_80x100.jpg)
![[WPF 3d, Three-Dimensional Graphics with WPF and C#]](book_wpf3d_80x100.png)
![[The C# Helper Top 100]](book_top100_80x100.png)
![[Interview Puzzles Dissected]](book_interview_puzzles_80x100.png)
![[C# 24-Hour Trainer]](book_csharp24hr_2e_79x100.jpg)
![[C# 5.0 Programmer's Reference]](book_csharp_prog_ref_80x100.png)
![[MCSD Certification Toolkit (Exam 70-483): Programming in C#]](book_c_cert_80x100.jpg)

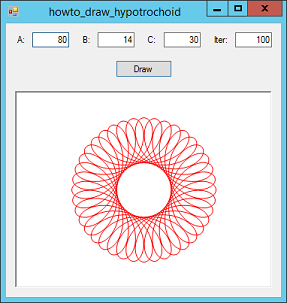
Title: Draw a hypotrochoid (Spirograph curve) in C#
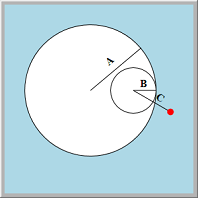
The hypotrochoid is a curve drawn by rolling a circle of radius B around the inside circumference of another of radius A. A point attached to the inner circle and distance C from its center draws the curve. (See the smaller picture on the right.)
The following parametric functions generate points along the hypotrochoid.
// The parametric function X(t). private double X(double t, double A, double B, double C) { return (A - B) * Math.Cos(t) + C * Math.Cos((A - B) / B * t); } // The parametric function Y(t). private double Y(double t, double A, double B, double C) { return (A - B) * Math.Sin(t) - C * Math.Sin((A - B) / B * t); } To trace the entire curve, the variable t must vary from 0 to 2 π B / GCD(A, B). For information on calculating the GCD (Greatest Common Divisor), see Calculate the greatest common divisor (GCD) and least common multiple (LCM) of two integers in C#. The program uses the following code to draw the complete curve when you enter parameters and click Draw. The iter parameter determines how many points the program uses. Bigger values give smoother results, although using very small values can be interesting, too.
// Draw the hypotrochoid.
private void btnDraw_Click(object sender, EventArgs e)
{
int A = int.Parse(txtA.Text);
int B = int.Parse(txtB.Text);
int C = int.Parse(txtC.Text);
int iter = int.Parse(txtIter.Text);
int wid = picCanvas.ClientSize.Width;
int hgt = picCanvas.ClientSize.Height;
Bitmap bm = new Bitmap(wid, hgt);
using (Graphics gr = Graphics.FromImage(bm))
{
gr.SmoothingMode = SmoothingMode.AntiAlias;
int cx = wid / 2;
int cy = hgt / 2;
double t = 0;
double dt = Math.PI / iter;
double max_t = 2 * Math.PI * B / GCD(A, B);
double x1 = cx + X(t, A, B, C);
double y1 = cy + Y(t, A, B, C);
List This code parses the parameters you entered. It then makes the variable t loop from 0 to the 2 π B / GCD(A, B). For each value of t, it adds the corresponding point to a list of points. After it finishes the loop, the code draws a polygon defined by the points.
Update: Bill Wonneberger has released a WPF program based on this example. Its features include:
You can download the program, see screenshots, and get more information on GitHub. Download the example to experiment with it and to see additional details. |