![[C# Helper]](../banner260x75.png)
|
|
 |
![[Beginning Database Design Solutions, Second Edition]](db2_79x100.png)

Title: Draw a Sierpinski fractal curve in C#
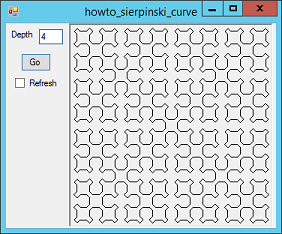
This example shows how to build a Sierpinski curve fractal, a space-filling curve that is in some ways similar to the Hilbert curve fractal. Enter the desired maximum depth of recursion and click Go to draw the curve. If you check the Refresh check box, the program refreshes the image as it draws each segment. This slows the program down greatly, but it lets you see the order in which the segments are drawn (which is kind of interesting). The curve is drawn by four methods named SierpA, SierpB, SierpC, and SierpD that draw curves across the top, right, bottom, and left sides of the area being drawn. The following code shows the SierpA method.
// Draw right across the top. private void SierpA(Graphics gr, float depth, float dx, float dy, ref float x, ref float y) { if (depth > 0) { depth--; SierpA(gr, depth, dx, dy, ref x, ref y); DrawRel(gr, ref x, ref y, dx, dy); SierpB(gr, depth, dx, dy, ref x, ref y); DrawRel(gr, ref x, ref y, 2 * dx, 0); SierpD(gr, depth, dx, dy, ref x, ref y); DrawRel(gr, ref x, ref y, dx, -dy); SierpA(gr, depth, dx, dy, ref x, ref y); } if (m_Refresh) picCanvas.Refresh(); }
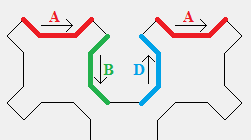
Each of the methods calls other methods to draw pieces of the curve. For example, SierpA calls itself to draw a horizontal section, draws a line down and to the right, calls SierpB to draw down, draws a horizontal segment, calls SierpD, draws another segment, and finishes by calling SierpA. (See the picture on the right.) The SierpA method (and the three other drawing methods) use the following DrawRel method to draw line segments relative to a starting point.
// Draw a line between (x, y) and (x + dx, y + dy). // Update x and y. private void DrawRel(Graphics gr, ref float x, ref float y, float dx, float dy) { gr.DrawLine(Pens.Black, x, y, x + dx, y + dy); x += dx; y += dy; } This method simply draws the required line segment and then updates the position (x, y) to the segment's end point. The Sierpinski method shown in the following code puts the pieces together by calling each of the other functions to draw the parts of the whole curve.
// Draw a Sierpinski curve. private void Sierpinski(Graphics gr, int depth, float dx, float dy) { float x = 2 * dx; float y = dy; SierpA(gr, depth, dx, dy, ref x, ref y); DrawRel(gr, ref x, ref y, dx, dy); SierpB(gr, depth, dx, dy, ref x, ref y); DrawRel(gr, ref x, ref y, -dx, dy); SierpC(gr, depth, dx, dy, ref x, ref y); DrawRel(gr, ref x, ref y, -dx, -dy); SierpD(gr, depth, dx, dy, ref x, ref y); DrawRel(gr, ref x, ref y, dx, -dy); picCanvas.Refresh(); } As a point of interest, note that space-filling curves like this one and the Hilbert curve can give approximate solutions to the Traveling Salesperson Problem (TSP). In the TSP, the goal is to visit a sequence of points and return to a starting point while following the shortest possible path. To use a Sierpinski (or Hilbert) curve to solve the TSP, simply overlay a space-filling curve on a map of the area and visit the destinations in the order in which the destinations are visited by the curve. The result isn't perfect but it's a pretty good start. Download the example to experiment with it and to see additional details. |
![[Beginning Software Engineering, Second Edition]](book_sw_eng2_79x100.png)
![[Essential Algorithms, Second Edition]](book_algs2e_79x100.png)
![[The Modern C# Challenge]](book_csharp_challenge_80x100.jpg)
![[WPF 3d, Three-Dimensional Graphics with WPF and C#]](book_wpf3d_80x100.png)
![[The C# Helper Top 100]](book_top100_80x100.png)
![[Interview Puzzles Dissected]](book_interview_puzzles_80x100.png)
![[C# 24-Hour Trainer]](book_csharp24hr_2e_79x100.jpg)
![[C# 5.0 Programmer's Reference]](book_csharp_prog_ref_80x100.png)
![[MCSD Certification Toolkit (Exam 70-483): Programming in C#]](book_c_cert_80x100.jpg)

