![[C# Helper]](../banner260x75.png)
|
|
 |
![[Beginning Database Design Solutions, Second Edition]](db2_79x100.png)

Title: Draw a Mandelbrot set fractal in C#
The Mandelbrot set uses an iterated equation to calculate colors for the points in a region. The equation is:
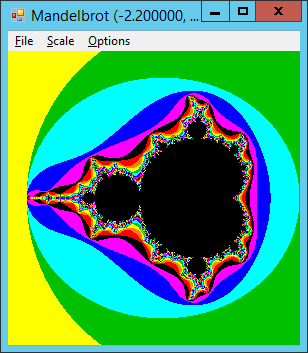
Z(n) = Z(n-1)2 + C Here the Z(n) and C are complex numbers. It can be shown that, if the magnitude of Z(n) ever exceeds 2, then it eventually diverges towards infinity. To find the color for the point (x, y), the program sets Z(0) = 0 and C = x + y * i. It then generates values for Z(n) until Z(n)'s magnitude exceeds 2 or it reaches some predetermined maximum number of iterations. At that point, the program uses the number of iterations it performed to assign the point's color. For example, if the program is using K colors and it performed I iterations, then it assigns the point color number I mod K. The following code shows how the program draws the Mandelbrot set.
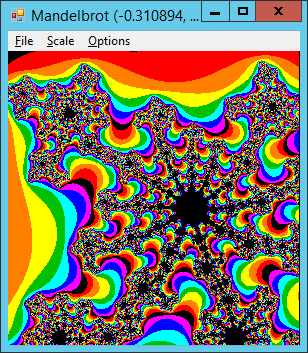
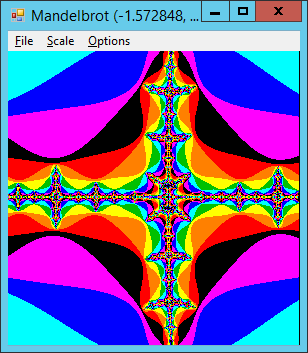
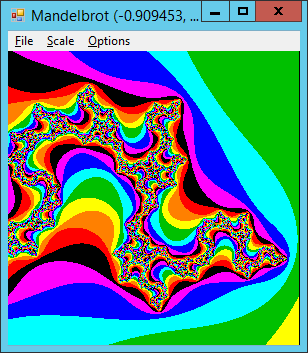
// Draw the Mandelbrot set. private void DrawMandelbrot() { // Work until the magnitude squared > 4. const int MAX_MAG_SQUARED = 4; // Make a Bitmap to draw on. m_Bm = new Bitmap(picCanvas.ClientSize.Width, picCanvas.ClientSize.Height); Graphics gr = Graphics.FromImage(m_Bm); // Clear. gr.Clear(picCanvas.BackColor); picCanvas.Image = m_Bm; Application.DoEvents(); // Adjust the coordinate bounds to fit picCanvas. AdjustAspect(); // dReaC is the change in the real part // (X value) for C. dImaC is the change in the // imaginary part (Y value). int wid = picCanvas.ClientRectangle.Width; int hgt = picCanvas.ClientRectangle.Height; double dReaC = (m_Xmax - m_Xmin) / (wid - 1); double dImaC = (m_Ymax - m_Ymin) / (hgt - 1); // Calculate the values. int num_colors = Colors.Count; double ReaC = m_Xmin; for (int X = 0; X < wid; X++) { double ImaC = m_Ymin; for (int Y = 0; Y < hgt; Y++) { double ReaZ = Zr; double ImaZ = Zim; double ReaZ2 = Z2r; double ImaZ2 = Z2im; int clr = 1; while ((clr < MaxIterations) && (ReaZ2 + ImaZ2 < MAX_MAG_SQUARED)) { // Calculate Z(clr). ReaZ2 = ReaZ * ReaZ; ImaZ2 = ImaZ * ImaZ; ImaZ = 2 * ImaZ * ReaZ + ImaC; ReaZ = ReaZ2 - ImaZ2 + ReaC; clr++; } // Set the pixel's value. m_Bm.SetPixel(X, Y, Colors[clr % num_colors]); ImaC += dImaC; } ReaC += dReaC; // Let the user know we//re not dead. if (X % 10 == 0) picCanvas.Refresh(); } Text = "Mandelbrot (" + m_Xmin.ToString("0.000000") + ", " + m_Ymin.ToString("0.000000") + ")-(" + m_Xmax.ToString("0.000000") + ", " + m_Ymax.ToString("0.000000") + ")"; } The program allows you to zoom in on areas of the set and to pick the color palette it uses to draw. If you resize the program or change the colors, use the Scale menu's Refresh command to redraw the fractal. The program lets you save its image in the usual formats (bmp, jpg, png, etc.). If you resize the form and redraw, you can make a really big version of the image you're viewing. Download the example to see the details. For more information on fractals, including information about the fascinating Julia set that uses the Mandelbrot set as a map, see my book Visual Basic Graphics Programming. The code is in Visual Basic 6 so you'll have to do some translating but the math still works. (I've had no luck trying to get my publisher, Wiley, to let me make a .NET version of the book. If you would buy a C# version of the book, let me know.) Download the example to experiment with it and to see additional details. |
![[Beginning Software Engineering, Second Edition]](book_sw_eng2_79x100.png)
![[Essential Algorithms, Second Edition]](book_algs2e_79x100.png)
![[The Modern C# Challenge]](book_csharp_challenge_80x100.jpg)
![[WPF 3d, Three-Dimensional Graphics with WPF and C#]](book_wpf3d_80x100.png)
![[The C# Helper Top 100]](book_top100_80x100.png)
![[Interview Puzzles Dissected]](book_interview_puzzles_80x100.png)
![[C# 24-Hour Trainer]](book_csharp24hr_2e_79x100.jpg)
![[C# 5.0 Programmer's Reference]](book_csharp_prog_ref_80x100.png)
![[MCSD Certification Toolkit (Exam 70-483): Programming in C#]](book_c_cert_80x100.jpg)


