![[C# Helper]](../banner260x75.png)
|
|
 |
![[Beginning Database Design Solutions, Second Edition]](db2_79x100.png)
![[Beginning Software Engineering, Second Edition]](book_sw_eng2_79x100.png)
![[Essential Algorithms, Second Edition]](book_algs2e_79x100.png)
![[The Modern C# Challenge]](book_csharp_challenge_80x100.jpg)
![[WPF 3d, Three-Dimensional Graphics with WPF and C#]](book_wpf3d_80x100.png)
![[The C# Helper Top 100]](book_top100_80x100.png)
![[Interview Puzzles Dissected]](book_interview_puzzles_80x100.png)
![[C# 24-Hour Trainer]](book_csharp24hr_2e_79x100.jpg)
![[C# 5.0 Programmer's Reference]](book_csharp_prog_ref_80x100.png)
![[MCSD Certification Toolkit (Exam 70-483): Programming in C#]](book_c_cert_80x100.jpg)

Title: Draw a graph in WPF and C#
Graphing Difficulties
This example shows how to draw a graph in WPF and C#. Drawing graphics is always tricky because you typically need to work in at least two different coordinate systems. First, there's the world coordinates that you want to use for the graph. For example, you might want X values to range over the years 2000 to 2020 and Y values to range over sales figure values between $10,000 and $100,000. The second coordinate system is the device coordinate system measured in pixels on the screen. Obviously you need to work with the world coordinate system when you're drawing things like the graph itself. The trickiest part occurs when you need to position something in world coordinates but draw in device coordinates. For example, suppose you want to draw X and Y axes with tic marks that are 5 pixels long. You use world coordinates to figure out where the tic marks should be placed, but then you need to calculate the lengths of the tic marks in pixels in device coordinates. Similarly suppose you want to draw some text on the graph to label something. You position the text in world coordinates, but you probably want to draw the text in device coordinates. Otherwise it's hard to center and otherwise align the text. The final weird problem I'll mention is making the graph's lines have a consistent thickness. Suppose you draw the graph in some normalized space and then scale it to fit the device area. For example, you draw in the world coordinate space 2000 <= x <= 2020, $10,000 <= y <= $100,000 and then you use a LayoutTransform to make the graph fit on a Canvas control. When the transform stretches the graph. It will also stretch the lines you drew for the graph. Unless the vertical and horizontal scale factors are the same, lines will be stretched by different amounts vertically and horizontally. Text is also stretched, giving some really annoying results. Anyway, to really place everything exactly where you want it, you need to be able to work freely in both world and device coordinates. This post begins a short series of articles examining techniques that you can use to draw graphs in WPF and C#.
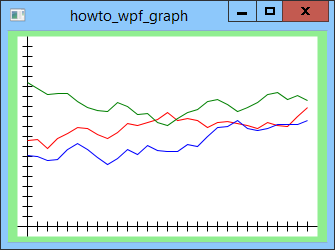
A Simple GraphThis example draws a simple graph using only device coordinates. In other words, all positions are measured in pixels with (0, 0) in the upper left corner. The following posts will show how to work in more convenient world coordinates. The following code shows the XAML that builds this program.
<Window x:Class="howto_wpf_graph.Window1" xmlns="http://schemas.microsoft.com/winfx/2006/xaml/presentation" xmlns:x="http://schemas.microsoft.com/winfx/2006/xaml" Title="howto_wpf_graph" Height="250" Width="335" Loaded="Window_Loaded"> <Grid Background="LightGreen"> <Canvas Name="canGraph" Background="White" Width="300" Height="200" VerticalAlignment="Center" HorizontalAlignment="Center"/> </Grid> </Window> The window's main child is a Grid that contains a Canvas named canGraph. In WPF, you don't normally draw directly on a drawing surface. You can if you really have to, but normally you use Line, Ellipse, Rectangle, and other shape controls to draw. You can include those objects in the XAML code if you like, but if you're going to draw a non-trivial graph, you're going to need to use code to do it. When this example starts, the following event handler builds the graph. (Notice the Loaded="Window_Loaded" part of the window's XAML declaration. That tells the program that the Window_Loaded method is the event handler for the window's Loaded event.)
// Draw a simple graph. private void Window_Loaded(object sender, RoutedEventArgs e) { const double margin = 10; double xmin = margin; double xmax = canGraph.Width - margin; double ymin = margin; double ymax = canGraph.Height - margin; const double step = 10; // Make the X axis. GeometryGroup xaxis_geom = new GeometryGroup(); xaxis_geom.Children.Add(new LineGeometry( new Point(0, ymax), new Point(canGraph.Width, ymax))); for (double x = xmin + step; x <= canGraph.Width - step; x += step) { xaxis_geom.Children.Add(new LineGeometry( new Point(x, ymax - margin / 2), new Point(x, ymax + margin / 2))); } Path xaxis_path = new Path(); xaxis_path.StrokeThickness = 1; xaxis_path.Stroke = Brushes.Black; xaxis_path.Data = xaxis_geom; canGraph.Children.Add(xaxis_path); // Make the Y ayis. GeometryGroup yaxis_geom = new GeometryGroup(); yaxis_geom.Children.Add(new LineGeometry( new Point(xmin, 0), new Point(xmin, canGraph.Height))); for (double y = step; y <= canGraph.Height - step; y += step) { yaxis_geom.Children.Add(new LineGeometry( new Point(xmin - margin / 2, y), new Point(xmin + margin / 2, y))); } Path yaxis_path = new Path(); yaxis_path.StrokeThickness = 1; yaxis_path.Stroke = Brushes.Black; yaxis_path.Data = yaxis_geom; canGraph.Children.Add(yaxis_path); // Make some data sets. Brush[] brushes = { Brushes.Red, Brushes.Green, Brushes.Blue }; Random rand = new Random(); for (int data_set = 0; data_set < 3; data_set++) { int last_y = rand.Next((int)ymin, (int)ymax); PointCollection points = new PointCollection(); for (double x = xmin; x <= xmax; x += step) { last_y = rand.Next(last_y - 10, last_y + 10); if (last_y < ymin) last_y = (int)ymin; if (last_y > ymax) last_y = (int)ymax; points.Add(new Point(x, last_y)); } Polyline polyline = new Polyline(); polyline.StrokeThickness = 1; polyline.Stroke = brushes[data_set]; polyline.Points = points; canGraph.Children.Add(polyline); } } The code first defines some boundaries for the graph. Next the program creates a GeometryGroup object to represent the X axis. A GeometryGroup can hold other geometry objects such as lines. The code creates a Line to represent the axis's baseline and adds it to the group. It then uses a loop to create a bunch of Line objects to represent tic marks and adds them to the group. After it finishes creating all of the axis's Line objects and adding them to the GeometryGroup, the program creates a Path object and sets its StrokeThickness and Stroke properties. It then sets the path's Data property equal to the GeometryGroup. Finally the code adds the path to the canGraph object's Children collection. The code then repeats those steps to create the Y axis. Next the code makes some graph data. For each data set, the code creates a PointCollection object. It generates a bunch of random points and adds them to the collection. When it's finished making data, the program creates a Polyline, sets its drawing properties, and sets its Points property to the point collection. Finally the code adds the Polyline to the canGraph object's Children collection. That's all the program needs to do. When the window appears, the Line and Polyline objects draw themselves as necessary.
What's Next?Unfortunately this method for positioning items precisely requires you to work in device coordinates. My next post will show how you can work more naturally in world coordinates. Download the example to experiment with it and to see additional details. |