![[C# Helper]](../banner260x75.png)
|
|
 |
![[Beginning Database Design Solutions, Second Edition]](db2_79x100.png)
![[Beginning Software Engineering, Second Edition]](book_sw_eng2_79x100.png)
![[Essential Algorithms, Second Edition]](book_algs2e_79x100.png)
![[The Modern C# Challenge]](book_csharp_challenge_80x100.jpg)
![[WPF 3d, Three-Dimensional Graphics with WPF and C#]](book_wpf3d_80x100.png)
![[The C# Helper Top 100]](book_top100_80x100.png)
![[Interview Puzzles Dissected]](book_interview_puzzles_80x100.png)
![[C# 24-Hour Trainer]](book_csharp24hr_2e_79x100.jpg)
![[C# 5.0 Programmer's Reference]](book_csharp_prog_ref_80x100.png)
![[MCSD Certification Toolkit (Exam 70-483): Programming in C#]](book_c_cert_80x100.jpg)

Title: Draw a strange attractor fractal in C#
This example shows how to draw one kind of strange attractor fractal. Many kinds of fractals use iterated systems to generate their points. They repeatedly apply one or more functions to a point to generate new points. For example, let X and Y be functions that take two parameters x and y and return new X and Y coordinate values for the next point in the sequence. In other words, if Pn = (xn, yn) is the n-th point in the sequence, then the n+1-th point is Pn+1 = (X(xn, yn), Y(xn, yn)). (You'll see some concrete examples in a moment.) When you plot a sequence of points (x0, y0), (x1, y1), ..., the points can settle into one of several patterns. For example, they can:
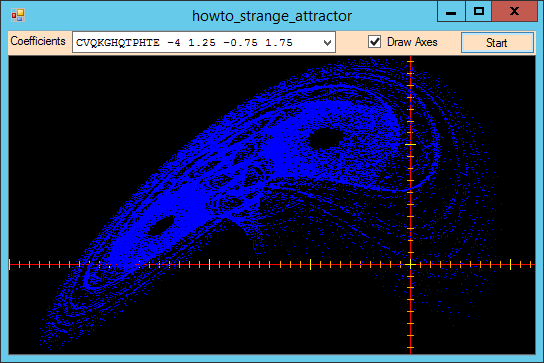
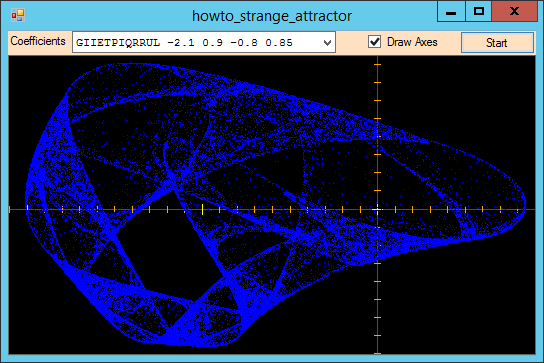
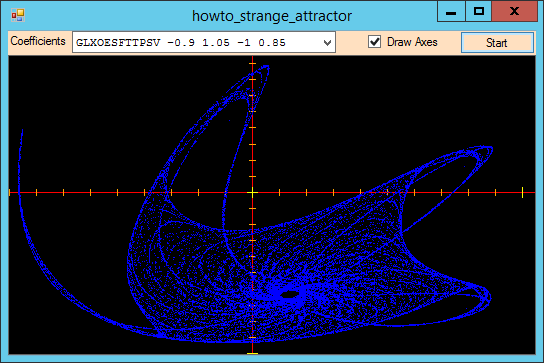
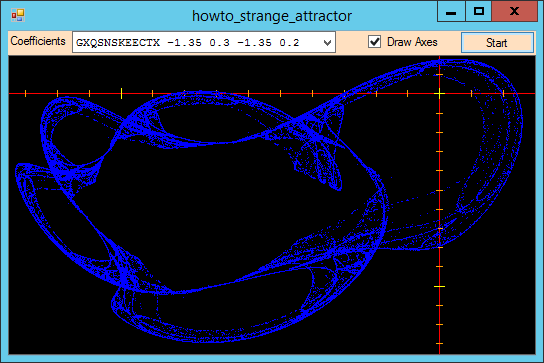
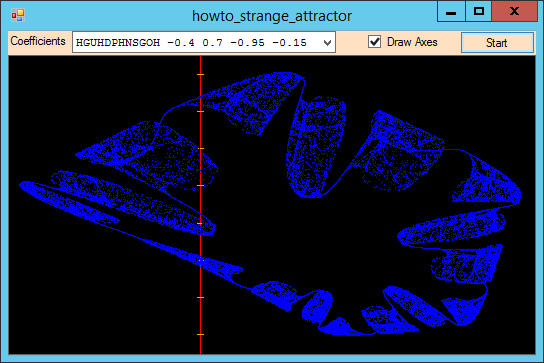
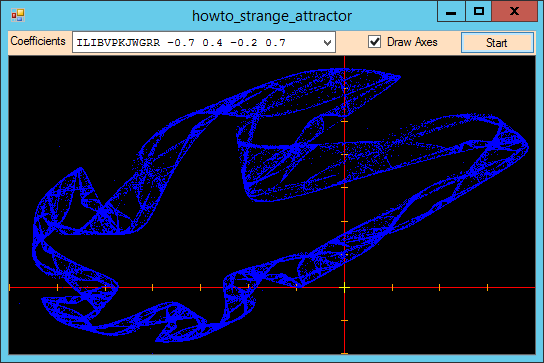
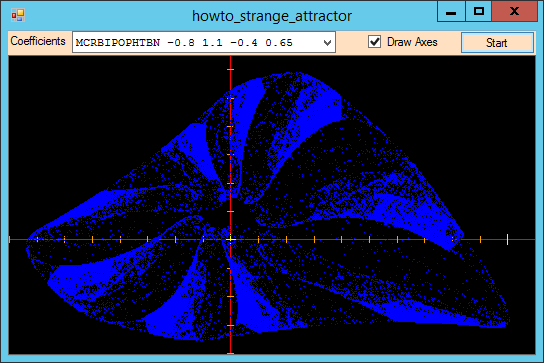
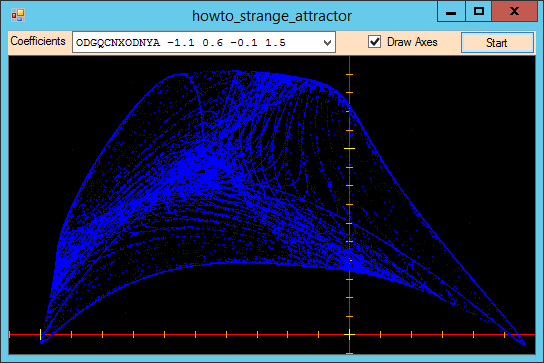
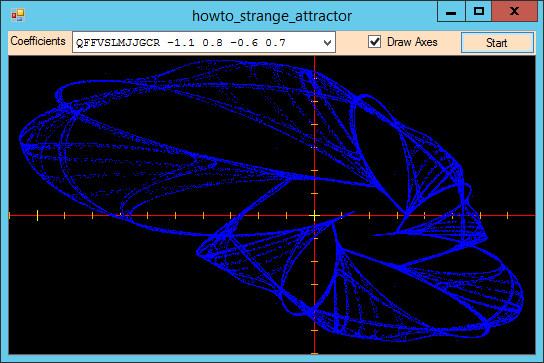
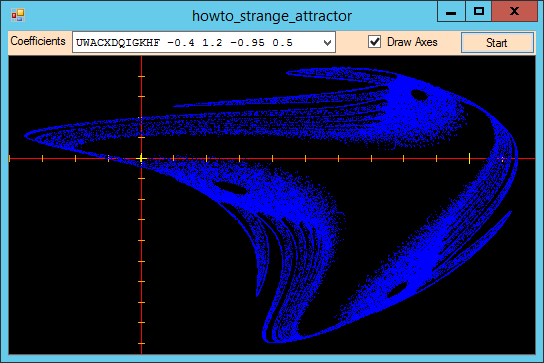
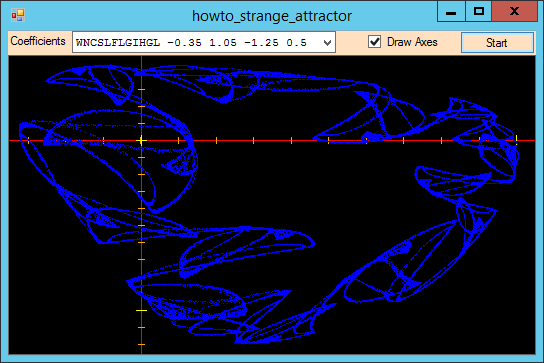
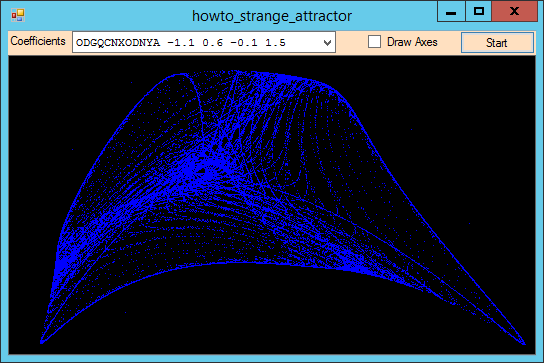
The points can also follow a strange attractor. In that case, the points clearly follow some sort of pattern but not an obvious repeating cycle. If you plot the points over time, a strange, ghostly image emerges. This example draws a particular strange attractor described by Eric W. Weisstein at Wolfram MathWorld. This example plots points given by the equations:
X(x, y) = A0 + A1 * x + A2 * x2 + A3 * x * y + A4 * y + A5 * y2
Y(x, y) = A6 + A7 * x + A8 * x2 + A9 * x * y + A10 * y + A11 * y2
For various values of the coefficients A0, A1, ... A11. The more points you plot, the more solid the fractal becomes. The program's dropdown uses letters to specify the fractal's coefficients Ai. It subtracts 'A' from each letter and multiplies by 0.1. For example, the letter O represents ('O' - 'A') * 0.1 = 14 * 0.1 = 1.4. This lets you specify the 12 coefficients with a single text string. (That's the way it's done on Wolfram Mathworld.) The numbers following the letters in the dropdown give the range of X and Y coordinates that should be displayed in the drawing. To make controlling the fractal easier, the program lets you start and stop generating points. It uses a Timer to make it easy to draw points while still allowing you to start and stop the drawing. When you click the Start button, the program enables its Timer and changes the button's text to Stop. When you click Stop, the program disables the Timer and sets the button's caption back to Start. The following code shows how the Tick event handler that draws the points.
// Plot 1,000 points. private void tmrDrawPoint_Tick(object sender, EventArgs e) { for (int i = 1; i <= 1000; i++) { double new_x = A[0] + A[1] * X + A[2] * X * X + A[3] * X * Y + A[4] * Y + A[5] * Y * Y; double new_y = A[6] + A[7] * X + A[8] * X * X + A[9] * X * Y + A[10] * Y + A[11] * Y * Y; X = new_x; Y = new_y; int pix_x = (int)Math.Round((X - Wxmin) / Wwid * Wid); int pix_y = (int)Math.Round(Hgt - (Y - Wymin) / Whgt * Hgt - 1); if ((pix_x >= 0) && (pix_x < Wid) && (pix_y >= 0) && (pix_y < Hgt)) { Bm.SetPixel(pix_x, pix_y, Color.Blue); } } // Display the result. picCanvas.Refresh(); } The Tick event handler plots 1,000 points at a time to improve performance and to reduce flicker. For each trip through the loop, the code generates the next point (X, Y) and draws it on the Bitmap named Bm. After it has finished its 1,000 points, the code the PictureBox that displays the Bitmap so you can see the result. See the code for additional details. Click the following thumbnails to see full-sized images of the 16 fractals drawn by this program.
Download the example to experiment with it and to see additional details. |