![[C# Helper]](../banner260x75.png)
|
|
 |
![[Beginning Database Design Solutions, Second Edition]](db2_79x100.png)
![[Beginning Software Engineering, Second Edition]](book_sw_eng2_79x100.png)
![[Essential Algorithms, Second Edition]](book_algs2e_79x100.png)
![[The Modern C# Challenge]](book_csharp_challenge_80x100.jpg)
![[WPF 3d, Three-Dimensional Graphics with WPF and C#]](book_wpf3d_80x100.png)
![[The C# Helper Top 100]](book_top100_80x100.png)
![[Interview Puzzles Dissected]](book_interview_puzzles_80x100.png)
![[C# 24-Hour Trainer]](book_csharp24hr_2e_79x100.jpg)
![[C# 5.0 Programmer's Reference]](book_csharp_prog_ref_80x100.png)
![[MCSD Certification Toolkit (Exam 70-483): Programming in C#]](book_c_cert_80x100.jpg)

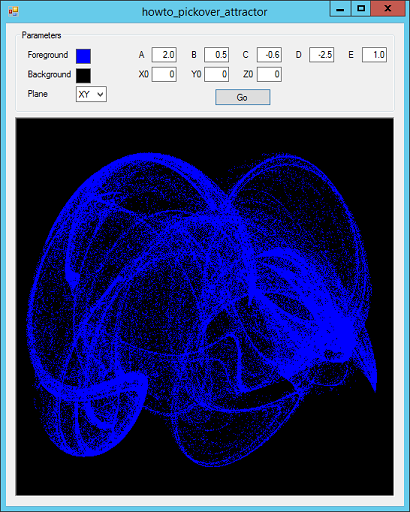
Title: Draw a Pickover strange attractor fractal in C#
This example shows how to to draw a Pickover strange attractor. Suppose you perform a series of iterations of equations to generate points. Sometimes the points converge to one or more points. For example, the equations X(n) = X(n - 1) / 2, Y(n) = Y(n - 1) / 3 approach the point (0, 0) as n grows large. The points to which the equations converge is called an attractor. Some equations are drawn towards a collection of points that is not easily defined but that somehow has a coherent shape. These points are called a strange attractor. Clifford Pickover discovered that the following equations generate points that are drawn to a strange attractor.
X(n) = Sin(A * Y(n - 1)) - Z(n - 1) * Cos(B * X(n - 1)) Y(n) = Z(n) * Sin(C * X(n - 1)) - Cos(D * Y(n - 1)) Z(n) = Sin(X(n - 1)) Here A, B, C, and D are constants. The following code plots these points.
// Draw the curve. private void DrawCurve() { // Get the parameters and otherwise get ready. Prepare(); // Start drawing. double x = X0, y = Y0, z = Z0; while (Running) { // Plot a bunch of points. for (int i = 1; i<=1000; i++) { // Move to the next point. double x2 = Math.Sin(A * y) - z * Math.Cos(B * x); double y2 = z * Math.Sin(C * x) - Math.Cos(D * y); z = Math.Sin(x); x = x2; y = y2; // Plot the point. switch (SelectedPlane) { case Plane.XY: bm.SetPixel( (int)(x * xscale + xoff), (int)(y * yscale + yoff), FgColor); break; case Plane.YZ: bm.SetPixel( (int)(y * yscale + yoff), (int)(z * zscale + zoff), FgColor); break; case Plane.XZ: bm.SetPixel( (int)(x * xscale + xoff), (int)(z * zscale + zoff), FgColor); break; } } // Refresh. picCanvas.Refresh(); // Check events to see if the user clicked Stop. Application.DoEvents(); } } Mots of this code is straightforward. Probably the least obvious code is the switch statement. To plot the three-dimensional points on the two-dimensional screen, the program simply drops on of the coordinates. The switch statement determines which coordinate is dropped and depends on the value you select from the Plane dropdown. Use the program's controls to plot X-Y, X-Z, or Y-Z projections of the points in different colors. You can also change the equations' constants and starting value to see what happens. Download the example to experiment with it and to see additional details. |