![[C# Helper]](../banner260x75.png)
|
|
 |
![[Beginning Database Design Solutions, Second Edition]](db2_79x100.png)
![[Beginning Software Engineering, Second Edition]](book_sw_eng2_79x100.png)
![[Essential Algorithms, Second Edition]](book_algs2e_79x100.png)
![[The Modern C# Challenge]](book_csharp_challenge_80x100.jpg)
![[WPF 3d, Three-Dimensional Graphics with WPF and C#]](book_wpf3d_80x100.png)
![[The C# Helper Top 100]](book_top100_80x100.png)
![[Interview Puzzles Dissected]](book_interview_puzzles_80x100.png)
![[C# 24-Hour Trainer]](book_csharp24hr_2e_79x100.jpg)
![[C# 5.0 Programmer's Reference]](book_csharp_prog_ref_80x100.png)
![[MCSD Certification Toolkit (Exam 70-483): Programming in C#]](book_c_cert_80x100.jpg)

Title: Draw a conic section from its polynomial equation in C#
This example shows how to draw a conic section from its polynomial equation. A previous series of posts explained how to find the intersection between two ellipses. See these posts for more information about that:
The method those articles described actually works for any conic section, not just ellipses, so I wanted to extend the method a bit. That begged two questions:
This post addresses the first of those questions. The following equation defines any conic section (ellipse, parabola, or hyperbola): 

The ± leads to two equations: one where you use the + sign and one where you use the - sign. Depending on the type of conic section and its orientation, this can lead the following five situations:
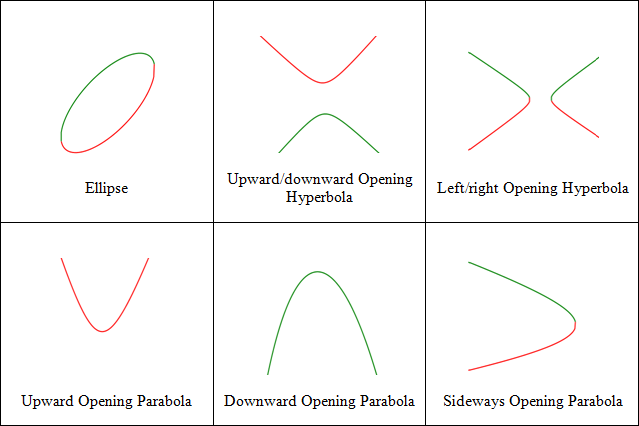
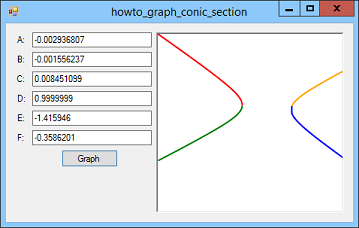
The green curves show equations that use the positive roots and the red curves show equations that use negative roots. When you enter a conic section's parameters and click Graph, the program parses the values you entered and then uses the following DrawConicSection method to draw the curve.
// Draw the conic section. private void DrawConicSection(Graphics gr, float A, float B, float C, float D, float E, float F) { // Get the X coordinate bounds. float xmin = 0; float xmax = xmin + picGraph.ClientSize.Width; // Find the smallest X coordinate with a real value. for (float x = xmin; x < xmax; x++) { float y = G1(x, A, B, C, D, E, F, -1f); if (IsNumber(y)) { xmin = x; break; } } // Find the largest X coordinate with a real value. for (float x = xmax; x > xmin; x--) { float y = G1(x, A, B, C, D, E, F, -1f); if (IsNumber(y)) { xmax = x; break; } } // Get points for the negative root on the left. List<PointF> ln_points = new List<PointF>(); float xmid1 = xmax; for (float x = xmin; x < xmax; x++) { float y = G1(x, A, B, C, D, E, F, -1f); if (!IsNumber(y)) { xmid1 = x - 1; break; } ln_points.Add(new PointF(x, y)); } // Get points for the positive root on the left. List<PointF> lp_points = new List<PointF>(); for (float x = xmid1; x >= xmin; x--) { float y = G1(x, A, B, C, D, E, F, +1f); if (IsNumber(y)) lp_points.Add(new PointF(x, y)); } // Make the curves on the right if needed. List<PointF> rp_points = new List<PointF>(); List<PointF> rn_points = new List<PointF>(); float xmid2 = xmax; if (xmid1 < xmax) { // Get points for the positive root on the right. for (float x = xmax; x > xmid1; x--) { float y = G1(x, A, B, C, D, E, F, +1f); if (!IsNumber(y)) { xmid2 = x + 1; break; } rp_points.Add(new PointF(x, y)); } // Get points for the negative root on the right. for (float x = xmid2; x <= xmax; x++) { float y = G1(x, A, B, C, D, E, F, -1f); if (IsNumber(y)) rn_points.Add(new PointF(x, y)); } } // Connect curves if appropriate. // Connect the left curves on the left. if (xmin > 0) lp_points.Add(ln_points[0]); // Connect the left curves on the right. if (xmid1 < picGraph.ClientSize.Width) ln_points.Add(lp_points[0]); // Make sure we have the right curves. if (rp_points.Count > 0) { // Connect the right curves on the left. rp_points.Add(rn_points[0]); // Connect the right curves on the right. if (xmax < picGraph.ClientSize.Width) rn_points.Add(rp_points[0]); } // Draw the curves. using (Pen thick_pen = new Pen(Color.Red, 2)) { thick_pen.Color = Color.Red; if (ln_points.Count > 1) gr.DrawLines(thick_pen, ln_points.ToArray()); thick_pen.Color = Color.Green; if (lp_points.Count > 1) gr.DrawLines(thick_pen, lp_points.ToArray()); thick_pen.Color = Color.Blue; if (rp_points.Count > 1) gr.DrawLines(thick_pen, rp_points.ToArray()); thick_pen.Color = Color.Orange; if (rn_points.Count > 1) gr.DrawLines(thick_pen, rn_points.ToArray()); } } The method starts by finding the smallest and largest X coordinate values within the PictureBox for which the function G1 is defined. For example, the ellipse's equations are only defined within a limited range of X (and Y) coordinate values. (The curve doesn't extend all the way to the left and right edges of the PictureBox.) The method finds the minimum defined X value by looping over values from 0 to the width of the PictureBox until it finds a defined value for G1. It then finds the maximum defined X value by looping over values from the width of the PictureBox down to 0 until it finds a defined value for G1. Next the method loops over the function G1 for its positive and negative roots. First it loops over increasing X values starting at the value xmin and using the negative root. One of two things can happen. First, the function G1 may be defined until x reaches the maximum X coordinate value xmax. This happens for the upward/downward opening hyperbola and the upward opening parabola. (It doesn't happen for the downward opening parabola because that case uses the positive root in the function G1 and the code hasn't gotten to that case yet.) Second, the function G1 may be undefined for some x value. This happens for the ellipse and the left/right opening hyperbola. In this case, the code saves the X coordinate that gave the last defined value in variable xmid1 and breaks out of the loop. As the method loops over the X coordinates, it saves the function's points in the list ln_points ("ln" stands for Left Negative). The most instructive situation to think about is the case of the left/right opening hyperbola. In that case, xmid1 gives the X coordinate for the rightmost point on the red curve on the left half of the hyperbola. Having found the points for the negative root on the left of the curve, the method loops over X coordinate values starting at xmid1 and decreasing to xmin, this time finding points with the positive root of G1. This time the method saves the function's points in the list lp_points ("lp" stands for Left Positive). If the curve is an ellipse, upward/downward opening hyperbola, upward opening parabola, or downward opening parabola, the points captured so far cover the entire curve. The remaining case is the left/right opening hyperbola. In that case, xmid1 is less than xmax and the method needs to find the right half of the curve. The code uses the positive root of G1 while looping over X coordinates starting at xmax and decreasing until it finds an undefined value. It then loops back from that point to xmax recording points generated by using the negative root of G1.
Note that some of the point lists may be empty. For example, the upward opening parabola is defined only by the G1 with the negative root so the other four lists are empty. There's only one issue remaining: The lists holding points generated with positive and negative roots generally do not connect exactly. For example, consider the left/right opening hyperbola. The points generated with the positive and negative roots for the left side of the curve should connect, but unless the program got very lucky and evaluated the equation G1 at exactly the rightmost X coordinate for that part of the curve, there will be a small gap between the two pieces. The next piece of the method connects any curves that should be connected. For example, if xmin is not at the very left edge of the PictureBox, then the positive and negative left curves should be connected at their left edges. To make that connection, the code adds the negative curve's first point to the end of the positive curve's points. The code uses similar tests to connect the right sides of the left curves, the left sides of the right curves, and the right sides of the right curves. Finally the method draws the points that define the curves, at least for the lists of points that are not empty. Download the example to experiment with it and to see additional details. |
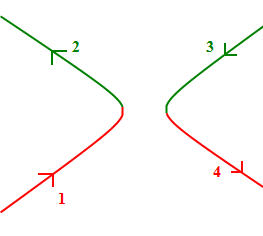 The image on the right shows the order in which the points are generated. The points are generated in this order: