![[C# Helper]](../banner260x75.png)
|
|
 |
![[Beginning Database Design Solutions, Second Edition]](db2_79x100.png)
![[Beginning Software Engineering, Second Edition]](book_sw_eng2_79x100.png)
![[Essential Algorithms, Second Edition]](book_algs2e_79x100.png)
![[The Modern C# Challenge]](book_csharp_challenge_80x100.jpg)
![[WPF 3d, Three-Dimensional Graphics with WPF and C#]](book_wpf3d_80x100.png)
![[The C# Helper Top 100]](book_top100_80x100.png)
![[Interview Puzzles Dissected]](book_interview_puzzles_80x100.png)
![[C# 24-Hour Trainer]](book_csharp24hr_2e_79x100.jpg)
![[C# 5.0 Programmer's Reference]](book_csharp_prog_ref_80x100.png)
![[MCSD Certification Toolkit (Exam 70-483): Programming in C#]](book_c_cert_80x100.jpg)

Title: Graph the gamma function in C#
![[Graph the gamma function in C#]](howto_gamma_function_graph.png)
The post Calculate the gamma function in C# uses numerical integration to calculate the gamma function. (See my book Essential Algorithms, Second Edition for information on numerical integration.) That method works fairly well for calculating Γ(x) where x ≥ 1. In particular, its values match the factorial fairly well for some rather large values of x. Unfortunately that method is not very accurate for values of x ≤ 0.5. For smaller values of x, it's better to use a different method. This post shows such a method and graphs it. The graph uses some useful tools and also shows one way to draw discontinuous functions.
The Lanczos ApproximationThe Lanczos approximation gives another way to approximate the gamma function. Follow that link for a description of the approximation and a basic Python implementation. For a C# translation, see this Rosetta Code entry. This example uses the following Rosetta Code function.
private static int g = 7; private static double[] p = { 0.99999999999980993, 676.5203681218851, -1259.1392167224028, 771.32342877765313, -176.61502916214059, 12.507343278686905, -0.13857109526572012, 9.9843695780195716e-6, 1.5056327351493116e-7 }; private double MyGammaDouble(double z) { if (z < 0.5) return Math.PI / (Math.Sin(Math.PI * z) * MyGammaDouble(1 - z)); z -= 1; double x = p[0]; for (var i = 1; i < g + 2; i++) x += p[i] / (z + i); double t = z + g + 0.5; return Math.Sqrt(2 * Math.PI) * (Math.Pow(t, z + 0.5)) * Math.Exp(-t) * x; } This code simply follows the approximation as described on Wikipedia.
Graphing ToolsOne of the biggest issues with drawing graphics is that you sometimes want to draw something in device coordinates (pixels) at a position specified in drawing coordinates. For example, you might want to draw a circle with a radius of 3 pixels at a specific point (x, y) on the graph. You need to map the point (x, y) onto the screen, but then you can't use the same mapping to draw the circle or it may come out stretched. To make it easier to perform that kind if drawing operation, this example provides several useful methods. The basic approach is to draw everything in pixels. The program then uses a transformation matrix to figure out where things should be drawn.
Making the TransformationThe following MakeTransforms method creates a transformation matrix to map world (drawing) coordinates to device coordinates.
// Make transformation matrices to map between // world coordinates to device coordinates. public static void MakeTransforms(this Graphics gr, float wxmin, float wymin, float wxmax, float wymax, float dxmin, float dymin, float dxmax, float dymax, bool apply_transform, out Matrix transform, out Matrix inverse) { RectangleF world_rect = new RectangleF( wxmin, wymin, wxmax - wxmin, wymax - wymin); PointF[] device_points = { new PointF(dxmin, dymax), new PointF(dxmax, dymax), new PointF(dxmin, dymin), }; transform = new Matrix(world_rect, device_points); inverse = transform.Clone(); inverse.Invert(); if (apply_transform) gr.Transform = transform; } This Graphics extension method first creates a rectangle to represent the world coordinates. It then makes an array of three points that indicate where the rectangle's upper left, upper right, and lower left corners should be mapped in device coordinates. The method assumes that you are drawing a graph, so it inverts the Y coordinates. For example, the world coordinate rectangle's upper left corner is at (xmin, ymin). If you were drawing that rectangle directly on the screen, that would be its upper left corner. However, in a graph the Y coordinates normally increase upward, so in world coordinate space (xmin, ymin) is the lower left corner of the coordinate area. To map that location (which the RectangleF uses as its upper left corner) to the correct location, we map it to (dxmin, dymax), the bottom left corner of the drawing area. (Yes, this is all very confusing and counterintuitive. That's the price we pay for having pixel coordinates increase downward instead of upward.) Having defined the world coordinate rectangle and the device coordinates where it should be mapped, the code uses the rectangle and point array to define a transformation matrix. The method copies the matrix and inverts the copy, so we can map back from device to world coordinates if we like. (Although this example does not do that.) If the method's apply_transform parameter is true, the method sets the Graphics object's Transform property to the transformation matrix. (This example does not do that.)
Transforming PointsIf you have a transformation matrix, you can use it to transform points from one coordinate system to another. In this example, that lets you transform points from world to device coordinates. Unfortunately the Matrix class's TransformPoints method transforms an array if points, but this example often needs to transform one point at a time. To make that easier, the program defines the following Matrix extension method.
public static PointF TransformPoint(this Matrix transform, PointF point) { PointF[] points = { point }; transform.TransformPoints(points); return points[0]; } This method simply creates an array to hold the single point passed in as a parameter. It uses the Matrix object's TransformPoints method to transform the array and returns the result.
Drawing Tick MarksIf you apply a transformation to a Graphics object, then when you call that object's drawing methods, the result is appropriately transformed. Things become more complicated if you want to position the object in world coordinates but size it in device coordinates. For example, suppose you want to draw five-pixel long tick marks along the X and Y axes. You need to position them in world coordinates, but make them five pixels long in device coordinates. The following WDrawTick method does that.
public static void WDrawTick( this Graphics gr, Matrix transform, Pen pen, PointF wp, float ddx, float ddy) { wp = transform.TransformPoint(wp); gr.DrawLine(pen, wp.X - ddx, wp.Y - ddy, wp.X + ddx, wp.Y + ddy); } This method transforms the point wp (which stands for "world point") into device coordinates. It then draws from that point offset by the distances (-ddx, -ddy) to that point offset by (ddx, ddy). For example, suppose you want to draw a vertical tick mark that is 6 pixels tall at the point (50, 100) in device coordinates. Then you would set ddx = 0 and ddy = 3, so the method would draw from (50 - 0, 100 - 3) to point (50 + 0, 100 + 3).
Plotting PointsThe following WPlotPoint method follows a similar pattern to the one used by WDrawTick.
public static void WPlotPoint( this Graphics gr, Matrix transform, Brush brush, Pen pen, PointF point, float drx, float dry) { point = transform.TransformPoint(point); RectangleF rect = new RectangleF( point.X - drx, point.Y - dry, 2 * drx, 2 * dry); if (brush != null) gr.FillEllipse(brush, rect); if (pen != null) gr.DrawEllipse(pen, rect); } This method first transforms the point wp into device coordinates. It then creates a rectangle centered at that point with half width (X radius) drx and half height (Y radius) dry. If the method's brush parameter is not null, the method fills the ellipse defined by the rectangle. Similarly if the method's pen parameter is not null, the method draws the ellipse.
Drawing TextThe following WDrawString method uses the same pattern.
public static void WDrawString( this Graphics gr, Matrix transform, string text, Font font, Brush brush, PointF point, float ddx, float ddy, StringFormat sf) { point = transform.TransformPoint(point); point.X += ddx; point.Y += ddy; gr.DrawString(text, font, brush, point, sf); } This method transforms the point where it should draw the text into device coordinates. It then draws the text at that point. The StringFormat parameter lets you decide how the text is aligned (left, right, above, below, or centered) with respect to the point.
Drawing the CurveThe basic idea is simple: make x iterate over values in some desired range, use the function to calculate the corresponding Y values, and draw lines connecting the points. There are two complicating issues here. First, we calculate the X and Y values in world coordinates but then draw them in device coordinates. By now you can probably figure out how to do that. Second, this particular function has some discontinuities where its value is undefined and where Y values jump abruptly from negative to positive infinity or vice versa. (See the picture at the top of the post.) We don't really want the graph to draw a vertical line connecting those two points. The following PlotCurve method draws a curve while handling those issues.
private void PlotCurve(Graphics gr, Matrix transform, Pen pen, Func<double, double> function, double xmin, double xmax, double dx) { const double ymin = -10000; const double ymax = 10000; List<PointF> points = new List<PointF>(); double last_y = function(xmin); for (double x = xmin; x <= xmax; x += dx) { // Calculate y. double y = function(x); if (y < ymin) y = ymin; if (y > ymax) y = ymax; // If y changed by too much, draw whatever we have. if (Math.Abs(y - last_y) > 1000) { if (points.Count > 1) { gr.WDrawLines(transform, pen, points.ToArray()); } points.Clear(); } points.Add(new PointF((float)x, (float)y)); last_y = y; } // Draw any remaining points. if (points.Count > 1) { gr.WDrawLines(transform, pen, points.ToArray()); } } The method creates a points list to hold points. It calculates the function's Y coordinate at the first X coordinate and saves it in the variable last_y. The method then makes variable x loop from xmin to xmax. For each x value, the code calculates the corresponding function value and makes sure it lies within a reasonable range, in this case between -10,000 and 10,000. The code then compares the new y value to the last saved value stored in last_y. If the value has changed by more than 1000, then the function is basically vertical. That means the function has entered or crossed one of its discontinuities. In that case, the code calls the WDrawLines extension method to draw any points that are currently in the points list and clears the list. Next, whether it drew the previous points or not, the code adds the new Y value to the points list. After it has finished looping through all of the X values, the code checks the points list one last time to see if it contains at least two points. If it does, the method draws it. The following code shows the WDrawLines extension method.
public static void WDrawLines( this Graphics gr, Matrix transform, Pen pen, PointF[] wpoints) { PointF[] dpoints = (PointF[])wpoints.Clone(); transform.TransformPoints(dpoints); gr.DrawLines(pen, dpoints); } Like the drawing methods described earlier, this method transforms its data from world to device coordinates and then uses the result to draw. This code creates a copy of the wpoints array so it doesn't mess up the original array. (That wouldn't hurt this example because the array passed into this method isn't used again later, but it's a good practice.) The code then uses the transformation matrix to transform the points into device coordinates and draws the points.
ConclusionThe main program performs a lot of graph drawing stuff. It draws the axes, tick marks, and tick mark labels. It uses the numerical integration method described by the previous example to draw the gamma function in red. It then uses the Lanczos approximation to draw the curve again in green. If you compare the picture at the top of the post to the following picture at Wikipedia, you can see that the green curve looks pretty good. Click the image below to go to the gamma function's Wikipedia entry.

By Alessio Damato - own work. This W3C-unspecified plot was created with Gnuplot. CC BY-SA 3.0. The function Γ(x) = (x - 1)! for positive integers, but it is also defined for the real numbers that are not non-positive integers (integers that are negative or zero). In fact, the gamma function is even defined for all complex numbers except for the non-positive integers. The following picture shows a three-dimensional plot of the absolute value of the gamma function for complex values.
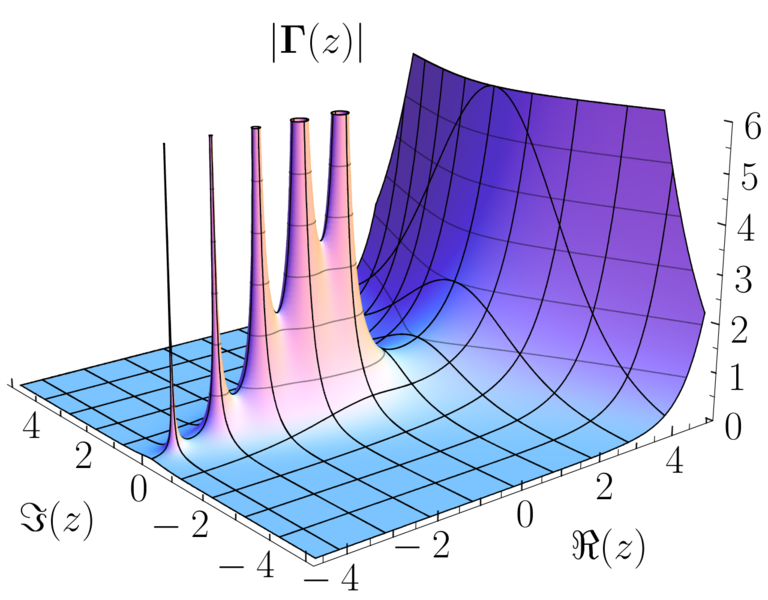
By Geek3 - Own work, CC BY-SA 3.0 Download the example to experiment with it and to see additional details. |