![[C# Helper]](../banner260x75.png)
|
|
 |
![[Beginning Database Design Solutions, Second Edition]](db2_79x100.png)
![[Beginning Software Engineering, Second Edition]](book_sw_eng2_79x100.png)
![[Essential Algorithms, Second Edition]](book_algs2e_79x100.png)
![[The Modern C# Challenge]](book_csharp_challenge_80x100.jpg)
![[WPF 3d, Three-Dimensional Graphics with WPF and C#]](book_wpf3d_80x100.png)
![[The C# Helper Top 100]](book_top100_80x100.png)
![[Interview Puzzles Dissected]](book_interview_puzzles_80x100.png)
![[C# 24-Hour Trainer]](book_csharp24hr_2e_79x100.jpg)
![[C# 5.0 Programmer's Reference]](book_csharp_prog_ref_80x100.png)
![[MCSD Certification Toolkit (Exam 70-483): Programming in C#]](book_c_cert_80x100.jpg)

Title: Examine the relationship between the Fibonacci sequence and phi in C#
The golden ratio (also called the golden mean, golden section, or divine proportion) is a number that pops up in a surprising number of places in geometry and nature. This number is also called φ (phi, pronounced either "fee" or "fie", but as far as I know not "foe" or "fum").
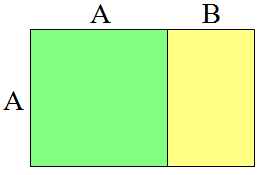
Consider the rectangles on the right. The ratio of the side lengths in the larger rectangle containing both the green and yellow parts is (A + B) / A. If you remove the green square with side lengths A, you get the smaller yellow rectangle. The ratio of the side lengths in the smaller yellow rectangle is A / B. The golden ratio φ is the value A / B that makes these two ratios the same. In other words, (A + B) / A = A / B. Geometrically it means that if you remove the green square from the larger rectangle, the result is a smaller rectangle with the same aspect ratio as the original rectangle. Because the smaller rectangle has the same aspect ratio, you can repeat the process and remove a B x B square from the smaller rectangle to get an even smaller rectangle that still has the same aspect ratio. You can repeat this process indefinitely to get some interesting results, which I may look at later. Suppose you let A = 1 and solve the equation (A + B) / A = A / B. Plugging in A = 1 gives:
(1 + B) / 1 = 1 / B Multiplying both sides by B gives:
B + B2 = 1 Subtracting 1 from both sides and rearranging a bit gives:
B2 + B - 1 = 0 Now you can plug this into the quadratic formula to get:

The value φ (phi) is the ratio of the long side to the short side. In this case, that's (A + B) / A. Because we assumed A was 1, the preceding equation means:

Ignoring the negative distance, φ = (1 + Sqrt(5)) / 2 ≈ 1.618. One surprising place that φ pops up is the Fibonacci sequence. Recall that the Fibonacci sequence is defined by Fib(n) = Fib(n - 1) + Fib(n - 2). Each value is the sum of the two before it so the sequence is 0, 1, 1, 2, 3, 5, ... It turns out that if you divide one number in the Fibonacci sequence by the previous number Fib(n) / Fib(n - 1), you get an approximation of φ. This program generates some of the values in the sequence, calculates their approximations for φ, and determines how close they are to the true value. It also graphs the approximations and the true value so you can see how quickly the approximations converge on the true value. When the program starts, it executes the following Form_Load event handler.
// The Fibonacci values. private double[] Fibonacci; // Phi. private double Phi; // Make a list of Fibonacci numbers. private void Form1_Load(object sender, EventArgs e) { // Display phi. Phi = (1 + Math.Sqrt(5)) / 2; txtPhi.Text = Phi.ToString("n15"); // Calculate Fibonacci values. Fibonacci = new double[45]; Fibonacci[0] = 0; Fibonacci[1] = 1; for (int n = 2; n < Fibonacci.Length; n++) { Fibonacci[n] = Fibonacci[n - 1] + Fibonacci[n - 2]; } // Display values. for (int n = 0; n < Fibonacci.Length; n++) { ListViewItem item = lvwValues.Items.Add(n.ToString()); item.SubItems.Add(Fibonacci[n].ToString()); if (n > 1) { double ratio = Fibonacci[n] / Fibonacci[n - 1]; item.SubItems.Add(ratio.ToString("n15")); double difference = ratio - Phi; item.SubItems.Add(difference.ToString("e2")); } } lvwValues.AutoResizeColumns( ColumnHeaderAutoResizeStyle.ColumnContent); } The program displays the true value of φ calculated by (1 + Math.Sqrt(5)) / 2. It then calculates 45 Fibonacci numbers. It loops through the numbers calculating the φ approximation and adding the values, approximations, and differences from the true value to a ListView control for display. The PictureBox control's Paint and Resize event handlers call the following DrawGraph method to draw the graph of the φ approximations.
// Draw the graph on a Graphics object. private void DrawGraph(Graphics gr) { gr.SmoothingMode = SmoothingMode.AntiAlias; using (Pen thin_pen = new Pen(Color.Black, 0)) { // Make a trsnaformation matrix to make drawing easier. const float xmin = -0.1f; const float ymin = -0.1f; const float xmax = 9.1f; const float ymax = 2.2f; RectangleF src_rect = new RectangleF( xmin, ymin, xmax - xmin, ymax - ymin); PointF[] pts = { new PointF(0, picGraph.ClientSize.Height), new PointF( picGraph.ClientSize.Width, picGraph.ClientSize.Height), new PointF(0, 0) }; Matrix trans = new Matrix(src_rect, pts); // Draw numbers along the X-axis. List<PointF> x_pt_list = new List<PointF>(); for (int x = (int)xmin; x <= xmax; x++) { x_pt_list.Add(new PointF(x, 0.1f)); } PointF[] x_pt_array = x_pt_list.ToArray(); trans.TransformPoints(x_pt_array); using (StringFormat string_format = new StringFormat()) { string_format.Alignment = StringAlignment.Center; string_format.LineAlignment = StringAlignment.Far; int index = 0; for (int x = (int)xmin; x <= xmax; x++) { gr.DrawString(x.ToString(), this.Font, Brushes.Black, x_pt_array[index], string_format); index++; } } // Draw numbers along the Y-axis. List<PointF> y_pt_list = new List<PointF>(); for (int y = (int)ymin; y <= ymax; y++) { y_pt_list.Add(new PointF(0.2f, y)); } PointF[] y_pt_array = y_pt_list.ToArray(); trans.TransformPoints(y_pt_array); using (StringFormat string_format = new StringFormat()) { string_format.Alignment = StringAlignment.Near; string_format.LineAlignment = StringAlignment.Center; int index = 0; for (int y = (int)ymin; y <= ymax; y++) { gr.DrawString(y.ToString(), this.Font, Brushes.Black, y_pt_array[index], string_format); index++; } } // Transform the Graphics object for drawing. gr.Transform = new Matrix(src_rect, pts); // Draw the axes. gr.DrawLine(thin_pen, xmin, 0, xmax, 0); for (int y = (int)ymin; y <= ymax; y++) { gr.DrawLine(thin_pen, -0.1f, y, 0.1f, y); } gr.DrawLine(thin_pen, 0, ymin, 0, ymax); for (int x = (int)xmin; x <= xmax; x++) { gr.DrawLine(thin_pen, x, -0.1f, x, 0.1f); } // Draw phi. thin_pen.Color = Color.Green; gr.DrawLine(thin_pen, xmin, (float)Phi, xmax, (float)Phi); // Draw the points. List<PointF> fib_points = new List<PointF>(); for (int n = 2; n <= xmax; n++) { float ratio = (float)(Fibonacci[n] / Fibonacci[n - 1]); fib_points.Add(new PointF(n, ratio)); } thin_pen.Color = Color.Red; //gr.DrawLines(thin_pen, fib_points.ToArray()); gr.DrawCurve(thin_pen, fib_points.ToArray()); } } The code sets the Graphics object's SmoothingMode property to produce a smooth result and then creates a zero-thickness pen that it uses for all drawing. (A pen with thickness 0 is always drawn 1 pixel wide no matter how the drawing is scaled.) Next the code defines a transformation matrix to map the world coordinates -0.1 ≤ X ≤ 9.1, -0.1 ≤ Y ≤ 2.2 to the PictureBox control's drawing surface. The transformation flips the coordinates over so the code can use a normal mathematical Y coordinate system with Y running from bottom-to-top and the result will be mapped to the PictureBox coordinate system in pixels where Y runs from top-to-bottom. The code saves this transformation in the variable trans. Next the code draws numbers along the X and Y axes. To avoid scaling the text so the font looks weird, the program uses the saved transformation to transform the points representing where the text should be drawn. It then draws the text without any transformation at the transformed locations. The result is normal-looking text drawn where it belongs after the transformation maps it onto the PictureBox. Now the code sets the Graphics object's transformation so future drawing is mapped from the mathematical world coordinate system to the PictureBox control's coordinate system. It then draws the axes and a green line showing the calculated value of φ. Finally the program gets to the interesting part. It creates a list of PointF and fills it with points representing the first several φ approximations. It creates one point per X coordinate value. The code then uses the Graphics object's DrawCurve method to connect the points with a smooth curve. Really the values only exist for integer values of X so the true data could be connected with lines instead of a smooth curve, but I think the curve looks better and does a better job of showing how the approximations quickly zoom in on the correct value. If you run the program and look at the error values displayed in the ListView control, you'll see that the approximation quickly becomes extremely close to the correct value. For example, the 9th approximation differs from the correct value by roughly 0.001. Download the example to experiment with it and to see additional details. |
![[Examine the relationship between the Fibonacci sequence and phi in C#]](howto_fibonacci_phi.png)