![[C# Helper]](../banner260x75.png)
|
|
 |
![[Beginning Database Design Solutions, Second Edition]](db2_79x100.png)
![[Beginning Software Engineering, Second Edition]](book_sw_eng2_79x100.png)
![[Essential Algorithms, Second Edition]](book_algs2e_79x100.png)
![[The Modern C# Challenge]](book_csharp_challenge_80x100.jpg)
![[WPF 3d, Three-Dimensional Graphics with WPF and C#]](book_wpf3d_80x100.png)
![[The C# Helper Top 100]](book_top100_80x100.png)
![[Interview Puzzles Dissected]](book_interview_puzzles_80x100.png)
![[C# 24-Hour Trainer]](book_csharp24hr_2e_79x100.jpg)
![[C# 5.0 Programmer's Reference]](book_csharp_prog_ref_80x100.png)
![[MCSD Certification Toolkit (Exam 70-483): Programming in C#]](book_c_cert_80x100.jpg)

Title: Draw an epitrochoid in C#
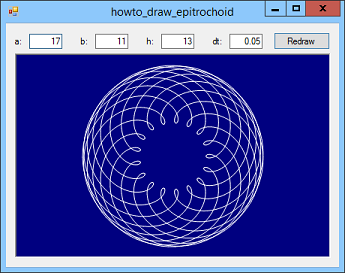
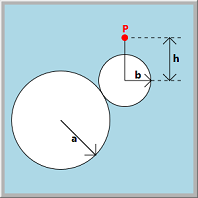 An epitrochoid is traced out by a point P attached to a circle of radius b rolling around a circle of radius a. (See the figure on the right.)
The shape is drawn by the following parametric equations:
To trace out the entire curve, the values passed into the Sin and Cos functions must start at 0 and end at a multiple of 2 * Pi. That means both t and (a + b) / b * t must end at a multiple of 2 * Pi. That happens if t ranges to b * 2 * Pi. (Assuming a and b are whole numbers.) The following code shows how this example paints its epitrochoid.
// Draw the epitrochoid. private void picCanvas_Paint(object sender, PaintEventArgs e) { e.Graphics.SmoothingMode = SmoothingMode.AntiAlias; e.Graphics.Clear(picCanvas.BackColor); // Scale and center. float scale = Math.Min( picCanvas.ClientSize.Width * 0.45f, picCanvas.ClientSize.Height * 0.45f); e.Graphics.ScaleTransform(scale, scale); e.Graphics.TranslateTransform( picCanvas.ClientSize.Width / 2, picCanvas.ClientSize.Height / 2, System.Drawing.Drawing2D.MatrixOrder.Append); // Draw the curve. float a = float.Parse(txtA.Text); float b = float.Parse(txtB.Text); float h = float.Parse(txtH.Text); DrawEpitrochoid(e.Graphics, a, b, h, 0.05f); } This code applies scale and translation transformations to the Graphics object so the result is as large as possible while still fitting in the PictureBox and so it is centered. It then parses the a, b, and h parameters, and calls the following DrawEpitrochoid method to draw the curve.
// Draw the curve on the indicated Graphics object. private void DrawEpitrochoid(Graphics gr, float a, float b, float h, float dt) { // Calculate the stop value for t. float stop_t = (float)(b * 2 * Math.PI); // Find the points. using (Pen the_pen = new Pen(Color.White, 0)) { PointF pt0, pt1; pt0 = new PointF(X(a, b, h, 0), Y(a, b, h, 0)); for (float t = dt; t <= stop_t; t += dt) { pt1 = new PointF(X(a, b, h, t), Y(a, b, h, t)); gr.DrawLine(the_pen, pt0, pt1); pt0 = pt1; } } } This code calculates a stopping value for t. It then makes points where t runs from 0 to stop_t and connects them. For more information about epitrochoids, see Wolfram MathWorld. Download the example to experiment with it and to see additional details. |
