![[C# Helper]](../banner260x75.png)
|
|
 |
![[Beginning Database Design Solutions, Second Edition]](db2_79x100.png)
![[Beginning Software Engineering, Second Edition]](book_sw_eng2_79x100.png)
![[Essential Algorithms, Second Edition]](book_algs2e_79x100.png)
![[The Modern C# Challenge]](book_csharp_challenge_80x100.jpg)
![[WPF 3d, Three-Dimensional Graphics with WPF and C#]](book_wpf3d_80x100.png)
![[The C# Helper Top 100]](book_top100_80x100.png)
![[Interview Puzzles Dissected]](book_interview_puzzles_80x100.png)
![[C# 24-Hour Trainer]](book_csharp24hr_2e_79x100.jpg)
![[C# 5.0 Programmer's Reference]](book_csharp_prog_ref_80x100.png)
![[MCSD Certification Toolkit (Exam 70-483): Programming in C#]](book_c_cert_80x100.jpg)

Title: Draw a chrysanthemum curve in C#
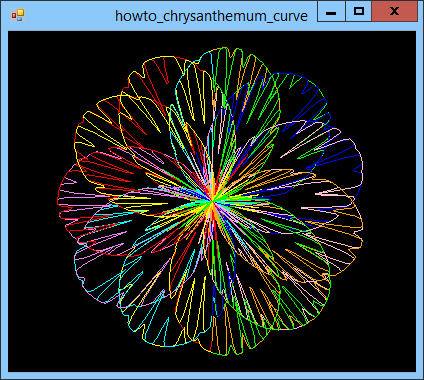
This program uses the following equations to draw the chrysanthemum curve: 
The form's Paint event handler loops variable t through the values 0 to 21π to generate the curve's points. Then then connects them. Don't worry too much about how the equation works. Focus on how the program draws it. The following code shows the Paint event handler.
// Draw the curve. private void Form1_Paint(object sender, PaintEventArgs e) { // Scale and translate. const float ymax = -11; const float ymin = 11; const float hgt = ymin - ymax; const float wid = hgt; float scale = Math.Min( this.ClientSize.Width / wid, this.ClientSize.Height / hgt); e.Graphics.ScaleTransform(scale, scale); e.Graphics.TranslateTransform( ClientSize.Width / 2, ClientSize.Height / 2, System.Drawing.Drawing2D.MatrixOrder.Append); // Draw the curve. const long num_lines = 5000; // Generate the points. double t = 0; double r = 5 * (1 + Math.Sin(11 * t / 5)) - 4 * Math.Pow(Math.Sin(17 * t / 3), 4) * Math.Pow(Math.Sin(2 * Math.Cos(3 * t) - 28 * t), 8); PointF pt1 = new PointF( (float)(r * Math.Sin(t)), (float)(-r * Math.Cos(t))); using (Pen the_pen = new Pen(Color.Blue, 0)) { for (int i = 0; i <= num_lines; i++) { t = i * Period * Math.PI / num_lines; r = 5 * (1 + Math.Sin(11 * t / 5)) - 4 * Math.Pow(Math.Sin(17 * t / 3), 4) * Math.Pow(Math.Sin( 2 * Math.Cos(3 * t) - 28 * t), 8); PointF pt0 = pt1; pt1 = new PointF( (float)(r * Math.Sin(t)), (float)(r * Math.Cos(t))); the_pen.Color = GetColor(t); e.Graphics.DrawLine(the_pen, pt0, pt1); } } } The code is reasonably straightforward (assuming you don't try to figure out the equation itself). It first scales and translates to make the curve fill the form. Then for each value of t, the code calculates the next point's X and Y coordinates and draws a segment connecting the point to the previous point. It calls the GetColor method to pick a color for the line. The GetColor method returns a color selected from a pre-initialized array of colors.
// Return a color from the Colors array. private Color GetColor(double t) { int index = (int)(t / Math.PI); return Colors[index % Colors.Length]; } This method divides the parameter t by π. Because t ranges from 0 to 21π, the result is an integer between 0 and 21. The code takes the result modulo the length of the array so the final value is between 0 and the length of the array, and then uses that as an index into the Colors array. (The Colors array actually contains more than 21 entries, so the modulus isn't really necessary, but it allows you to make t vary over a wider range of values safely. For example, try setting te constant Period to 100 or 1,000 and see what happens.) Download the example to experiment with it and to see additional details. |