![[C# Helper]](../banner260x75.png)
|
|
 |
![[Beginning Database Design Solutions, Second Edition]](db2_79x100.png)
![[Beginning Software Engineering, Second Edition]](book_sw_eng2_79x100.png)
![[Essential Algorithms, Second Edition]](book_algs2e_79x100.png)
![[The Modern C# Challenge]](book_csharp_challenge_80x100.jpg)
![[WPF 3d, Three-Dimensional Graphics with WPF and C#]](book_wpf3d_80x100.png)
![[The C# Helper Top 100]](book_top100_80x100.png)
![[Interview Puzzles Dissected]](book_interview_puzzles_80x100.png)
![[C# 24-Hour Trainer]](book_csharp24hr_2e_79x100.jpg)
![[C# 5.0 Programmer's Reference]](book_csharp_prog_ref_80x100.png)
![[MCSD Certification Toolkit (Exam 70-483): Programming in C#]](book_c_cert_80x100.jpg)

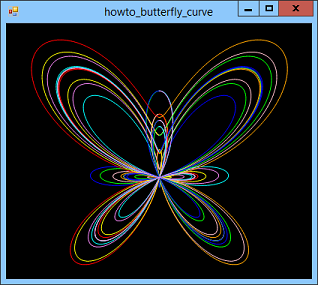
Title: Draw a colored butterfly curve in C#
This program uses the following equations to draw the butterfly curve:

The following Paint event handler draws the curve.
private const int period = 24; // Draw the butterfly. private void Form1_Paint(object sender, PaintEventArgs e) { e.Graphics.SmoothingMode = SmoothingMode.AntiAlias; e.Graphics.Clear(this.BackColor); // Scale and translate. RectangleF world_rect = new RectangleF(-4.0f, -4.4f, 8.0f, 7.3f); float cx = (world_rect.Left + world_rect.Right) / 2; float cy = (world_rect.Top + world_rect.Bottom) / 2; // Center the world coordinates at origin. e.Graphics.TranslateTransform(-cx, -cy); // Scale to fill the form. float scale = Math.Min( this.ClientSize.Width / world_rect.Width, this.ClientSize.Height / world_rect.Height); e.Graphics.ScaleTransform(scale, scale, MatrixOrder.Append); // Move the result to center on the form. e.Graphics.TranslateTransform( this.ClientSize.Width / 2, this.ClientSize.Height / 2, MatrixOrder.Append); // Generate the points. PointF pt0, pt1; double t = 0; double expr = Math.Exp(Math.Cos(t)) - 2 * Math.Cos(4 * t) - Math.Pow(Math.Sin(t / 12), 5); pt1 = new PointF( (float)(Math.Sin(t) * expr), (float)(-Math.Cos(t) * expr)); using (Pen the_pen = new Pen(Color.Blue, 0)) { const long num_lines = 5000; for (long i = 0; i < num_lines; i++) { t = i * period * Math.PI / num_lines; expr = Math.Exp(Math.Cos(t)) - 2 * Math.Cos(4 * t) - Math.Pow(Math.Sin(t / 12), 5); pt0 = pt1; pt1 = new PointF( (float)(Math.Sin(t) * expr), (float)(-Math.Cos(t) * expr)); the_pen.Color = GetColor(t); e.Graphics.DrawLine(the_pen, pt0, pt1); } } } The code uses translation and scale transformations to make the curve fit the form nicely. It then loops the variable t from 0 to 24π to generate the points along the curve. For the each line segment between a pair of adjacent points, the code calls the following GetColor method to pick a color for that segment and then draws it.
// Return an appropriate color for this segment. private Color GetColor(double t) { return Colors[(int)(t / Math.PI)]; } The GetColor method divides the parameter t by π and uses the result as an index into the Colors array, which is initialized in the form's Load event handler.
private Color[] Colors; // Initialize the colors. private void Form1_Load(object sender, EventArgs e) { // Redraw when resized. this.ResizeRedraw = true; Colors = new Color[] { Color.Pink, Color.Red, ... Color.Violet }; } Download the example to experiment with it and to see additional details. |